- High 12:49 AM 8.8 ft
- Low 6:41 AM 1.5 ft
- High 12:50 PM 9.9 ft
- Low 7:16 PM 0.5 ft
First light 6:00 AMSunrise 6:30 AMSunset 4:24 PMLast light 4:54 PM

Free. No app store and no account; it's the same site, one tap away.
NOAA tide station 8444525 · Massachusetts · updated Nov 12, 2026
Fri, Nov 13: High tide 1:31 AM (8.5 ft) and 1:33 PM (9.6 ft); low tide 7:23 AM (1.7 ft) and 7:59 PM (0.8 ft).
Buoy: NOAA NDBC 44013 (BOSTON 16 NM East of Boston, MA), 16 mi away. Buoy readings are recent observations, not a surf forecast. Wind: observed at NOAA NDBC station 44013 (BOSTON 16 NM East of Boston, MA), 16 mi away; forecast from the NOAA National Weather Service (api.weather.gov).
Shaded = night · heights in feet above MLLW · local time
First light 6:00 AMSunrise 6:30 AMSunset 4:24 PMLast light 4:54 PM
First light 6:01 AMSunrise 6:32 AMSunset 4:23 PMLast light 4:54 PM
First light 6:02 AMSunrise 6:33 AMSunset 4:22 PMLast light 4:53 PM
First light 6:03 AMSunrise 6:34 AMSunset 4:21 PMLast light 4:52 PM
First light 6:05 AMSunrise 6:35 AMSunset 4:20 PMLast light 4:51 PM
Today is a poor fishing day (solunar + tide)
3/10
Waxing crescent · 17% lit · Full moon Tue, Nov 24
| TodayNov 13 | 3/10Poor | Major 1:39 am – 3:39 am · 2:04 pm – 4:04 pm Minor 10:15 am – 11:15 am · 6:57 pm – 7:57 pm |
|---|---|---|
| SatNov 14 | 4/10Fair | Major 2:29 am – 4:29 am · 2:53 pm – 4:53 pm Minor 10:52 am – 11:52 am · 7:59 pm – 8:59 pm |
| SunNov 15 | 4/10Fair | Major 3:16 am – 5:16 am · 3:39 pm – 5:39 pm Minor 11:23 am – 12:23 pm · 9:02 pm – 10:02 pm |
| MonNov 16 | 5/10Fair | Major 4:02 am – 6:02 am · 4:24 pm – 6:24 pm Minor 11:49 am – 12:49 pm · 10:07 pm – 11:07 pm |
| TueNov 17 | 5/10Fair | Major 4:45 am – 6:45 am · 5:07 pm – 7:07 pm Minor 12:12 pm – 1:12 pm · 11:11 pm – 12:11 am |
| WedNov 18 | 5/10Fair | Major 5:28 am – 7:28 am · 5:49 pm – 7:49 pm Minor 12:33 pm – 1:33 pm |
| ThuNov 19 | 7/10Good | Major 6:11 am – 8:11 am · 6:33 pm – 8:33 pm Minor 12:17 am – 1:17 am · 12:53 pm – 1:53 pm |
Solunar theory says fish feed more when the moon is overhead or underfoot (major periods, about 2 hours) and around moonrise and moonset (minor periods, about 1 hour). We score each day from 1 to 10 by checking when those periods happen, using the NOAA tide predictions for station 8444525 and the sun times for this spot:
| Base | every day starts at 1 | 1 |
|---|---|---|
| Sunrise / sunset | a period overlaps sunrise or sunset ±1 h: major +2, minor +1 (max 3) (Moon overhead × sunset +2) | 2 |
| Tide | a NOAA high or low falls inside a period (tide change): major +2, minor +1; moving water during a major period (no high/low within 1 h of it) +1 (max 4) | 0 |
| Moon phase | within 2 days of a new or full moon +2, within 4 days +1 (today: 4.4 days) | 0 |
| Today | 3, rounded | 3/10 |
1–3 poor · 4–5 fair · 6–7 good · 8–10 excellent. Solunar times are a rule of thumb, not a guarantee: weather, water temperature and bait matter a lot. Tide changes and moving water are specific to this station, so nearby spots can score differently.
Solunar periods calculated for 42.28, -70.95 (moon times from astronomical equations, local time). Not a fishing forecast.
Today is a poor fishing day (solunar + tide)
2/10
Waxing crescent · 11% lit · Full moon Tue, Nov 24
| TodayNov 12 | 2/10Poor | Major 12:48 am – 2:48 am · 1:13 pm – 3:13 pm Minor 9:29 am – 10:29 am · 5:59 pm – 6:59 pm |
|---|---|---|
| FriNov 13 | 3/10Poor | Major 1:39 am – 3:39 am · 2:04 pm – 4:04 pm Minor 10:15 am – 11:15 am · 6:57 pm – 7:57 pm |
| SatNov 14 | 4/10Fair | Major 2:29 am – 4:29 am · 2:53 pm – 4:53 pm Minor 10:52 am – 11:52 am · 7:59 pm – 8:59 pm |
| SunNov 15 | 4/10Fair | Major 3:16 am – 5:16 am · 3:39 pm – 5:39 pm Minor 11:23 am – 12:23 pm · 9:02 pm – 10:02 pm |
| MonNov 16 | 5/10Fair | Major 4:02 am – 6:02 am · 4:24 pm – 6:24 pm Minor 11:49 am – 12:49 pm · 10:07 pm – 11:07 pm |
| TueNov 17 | 5/10Fair | Major 4:45 am – 6:45 am · 5:07 pm – 7:07 pm Minor 12:12 pm – 1:12 pm · 11:11 pm – 12:11 am |
| WedNov 18 | 5/10Fair | Major 5:28 am – 7:28 am · 5:49 pm – 7:49 pm Minor 12:33 pm – 1:33 pm |
Solunar theory says fish feed more when the moon is overhead or underfoot (major periods, about 2 hours) and around moonrise and moonset (minor periods, about 1 hour). We score each day from 1 to 10 by checking when those periods happen, using the NOAA tide predictions for station 8444525 and the sun times for this spot:
| Base | every day starts at 1 | 1 |
|---|---|---|
| Sunrise / sunset | a period overlaps sunrise or sunset ±1 h: major +2, minor +1 (max 3) | 0 |
| Tide | a NOAA high or low falls inside a period (tide change): major +2, minor +1; moving water during a major period (no high/low within 1 h of it) +1 (max 4) | 0 |
| Moon phase | within 2 days of a new or full moon +2, within 4 days +1 (today: 3.4 days) | 1 |
| Today | 2, rounded | 2/10 |
1–3 poor · 4–5 fair · 6–7 good · 8–10 excellent. Solunar times are a rule of thumb, not a guarantee: weather, water temperature and bait matter a lot. Tide changes and moving water are specific to this station, so nearby spots can score differently.
Solunar periods calculated for 42.28, -70.95 (moon times from astronomical equations, local time). Not a fishing forecast.
| Thu, Nov 12 | High 12:49 AM 8.80 ft | Low 6:41 AM 1.50 ft | High 12:50 PM 9.90 ft | Low 7:16 PM 0.49 ft |
|---|---|---|---|---|
| Fri, Nov 13 | High 1:31 AM 8.54 ft | Low 7:23 AM 1.71 ft | High 1:33 PM 9.62 ft | Low 7:59 PM 0.82 ft |
| Sat, Nov 14 | High 2:14 AM 8.30 ft | Low 8:07 AM 1.93 ft | High 2:18 PM 9.32 ft | Low 8:44 PM 1.13 ft |
| Sun, Nov 15 | High 3:01 AM 8.12 ft | Low 8:55 AM 2.12 ft | High 3:06 PM 9.04 ft | Low 9:32 PM 1.36 ft |
| Mon, Nov 16 | High 3:50 AM 8.05 ft | Low 9:46 AM 2.24 ft | High 3:58 PM 8.83 ft | Low 10:21 PM 1.48 ft |
| Tue, Nov 17 | High 4:41 AM 8.11 ft | Low 10:40 AM 2.23 ft | High 4:50 PM 8.71 ft | Low 11:11 PM 1.47 ft |
| Wed, Nov 18 | High 5:31 AM 8.33 ft | Low 11:34 AM 2.05 ft | High 5:43 PM 8.70 ft | |
| Thu, Nov 19 | Low 12:00 AM 1.36 ft | High 6:19 AM 8.69 ft | Low 12:28 PM 1.68 ft | High 6:36 PM 8.80 ft |
| Fri, Nov 20 | Low 12:49 AM 1.18 ft | High 7:06 AM 9.19 ft | Low 1:21 PM 1.15 ft | High 7:29 PM 9.00 ft |
Times are local (standard/daylight). Heights in feet above MLLW.
NOAA station 8444525 is 5.5 mi southwest of Hull, MA, the nearest beach or town with its own page here. It is a harmonic reference station (predicted directly from its own tidal constituents).
Nut Island, Quincy Bay has a semidiurnal tide: two high tides and two low tides of similar height each day. The average rise or fall between high and low tide is 9.1 ft, growing to about 11.4 ft at spring tides (around new and full moon) and shrinking to about 8.2 ft at neap tides (around the quarter moons). The highest tide predicted in the next 12 months is 11.8 ft on December 25, 2026 at 11:38 AM; the lowest is -1.7 ft on January 23, 2027 at 5:52 PM, and 169 low tides in that period drop below zero (MLLW).
From Fri, Nov 13 to Thu, Nov 19, high tides at Nut Island, Quincy Bay range from 8.0 ft to 9.6 ft; the biggest is on Fri, Nov 13 at 1:33 PM. The lowest low is 0.8 ft on Fri, Nov 13 at 7:59 PM. Low tides in daylight (sunrise to sunset): Fri 7:23 AM (1.7 ft); Sat 8:07 AM (1.9 ft); Sun 8:55 AM (2.1 ft); Mon 9:46 AM (2.2 ft); Tue 10:40 AM (2.2 ft); Wed 11:34 AM (2.0 ft); Thu 12:28 PM (1.7 ft).
Tide statistics computed from NOAA high/low predictions for Oct 2026 – Oct 2027; heights in feet above MLLW. Predictions are astronomical and do not include weather.
Surf fishing and beach gear often used here — search links, not a ranked list.
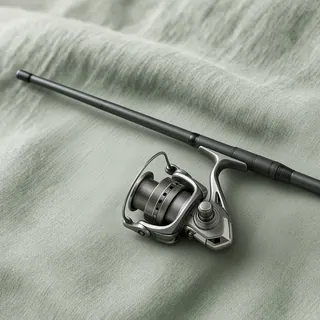 Surf fishing rodon Amazon →
 Saltwater tackle boxon Amazon →
 Crab trapon Amazon →
 Beach carton Amazon →
 Polarized sunglasseson Amazon →
 Tide clockon Amazon →
As an Amazon Associate, TideCharts USA earns from qualifying purchases. How this works
On Fri, Nov 13, predicted high tide at Nut Island, Quincy Bay, MA is at 1:31 AM, 1:33 PM local time.
On Fri, Nov 13, predicted low tide at Nut Island, Quincy Bay, MA is at 7:23 AM, 7:59 PM local time.
On Sat, Nov 14, predicted high tides are at 2:14 AM (8.3 ft) and 2:18 PM (9.3 ft); low tides are at 8:07 AM (1.9 ft) and 8:44 PM (1.1 ft) (local time).
The average range between high and low tide is 9.1 ft; about 11.4 ft at spring tides and 8.2 ft at neap tides. The highest tide predicted in the next 12 months is 11.8 ft on December 25, 2026 (NOAA predictions, MLLW).
Predictions come from NOAA's Center for Operational Oceanographic Products and Services (CO-OPS), station 8444525. Heights are in feet relative to Mean Lower Low Water (MLLW).